PYPLOT(PYTHON中绘制2D图表)使用详解(二)
在学习机器学习与PYTHON的相关内容中,接触到了pyplot这个子库,感觉非常有用,可是网络上的文章大部分都是比较零散的,于是打算按照官方文档,进行一个简单翻译与演示,详细记录一下该库的使用方法。这是本系列的第二篇,每篇大约讲解20个方法,但有些方法官方也未给出详细的用法,待以后使用中慢慢摸索后再补充。
二、方法介绍(21~40)
21、draw() —— 重新绘制当前figure
主要用于更新一个没有设置为自动更新的figure,应用于交互环境中
参考代码:待补充
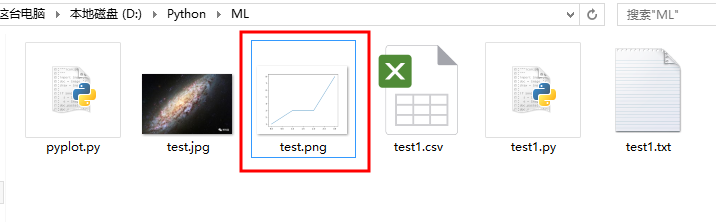
22、savefig() —— 保存当前figure
来自于Figure.savefig类,用于将当前figure输出到postscript
基本格式:
savefig(fname, dpi=None, facecolor='w', edgecolor='w',
        orientation='portrait', papertype=None, format=None,
        transparent=False, bbox_inches=None, pad_inches=0.1,
        frameon=None)
参数说明:
dpi:[None | scalar>0] 每英寸的分辨率
facecolor,edgecolor:matplotlib色彩 figure图像颜色
orientation: ['landscape'|'portait'] 不支持所有的后台,目前只能在PostScript输出
papertype:'letter','legal','executive','ledger','a0' through 'a10', 'b0' throuth 'b10'等 纸张类型
format: png,pdf,ps,eps,svg等,扩展名
transparent:透明度
frameon:[True|False] 背景图是否现实
bbox_inches: 'tight' 边缘空白区域大小设置
参考代码:
import matplotlib.pyplot as plt
plt.figure(1)
plt.plot([1,3,3,8])
plt.savefig('D:\\python\\ML\\test')
操作结果(在指定目录生成了test.png图片):
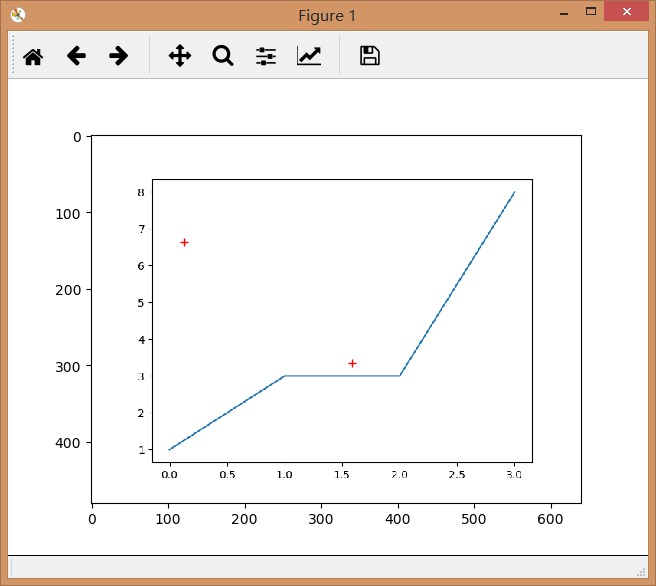
23、ginput() —— 交互式标注
可以利用该工具实现图像中点的拾取等操作
参考代码:
import matplotlib.pyplot as plt
import matplotlib.image as mpimg  # 用于导入图片
print(plt.gci()) # 在未向plt中添加内容时,返回None
img = mpimg.imread('D:\\python\\ML\\test.png')  # 导入图片
plt.imshow(img)  # 将图片在plt中显示
print('Please click 3 porints') # 输出一个提示语句
x = plt.ginput(3)  # 捕获用户点击坐标
print(x) # 打印坐标
操作结果:
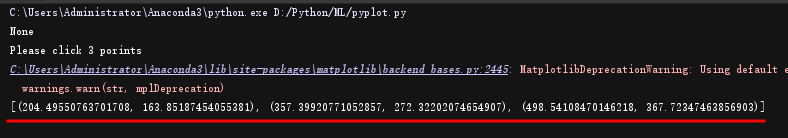
暂时请忽略这个报错。
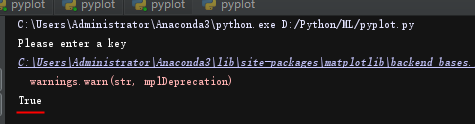
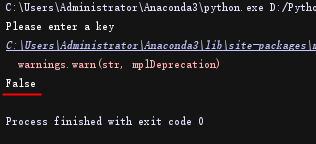
24、waitforbuttonpress() —— 监听键盘按键
如果用户按的是键盘,返回True,如果是其他(如鼠标单击),则返回False
参考代码:
import matplotlib.pyplot as plt
plt.figure(1) # 创建figure
plt.grid() # 展示网格
print('Please enter a key') # 提示按键
a = plt.waitforbuttonpress() # 捕捉按键
print(a) # 打印捕捉返回结果
操作结果:
1、按下某个键盘按键,返回True
2、单击鼠标,返回False
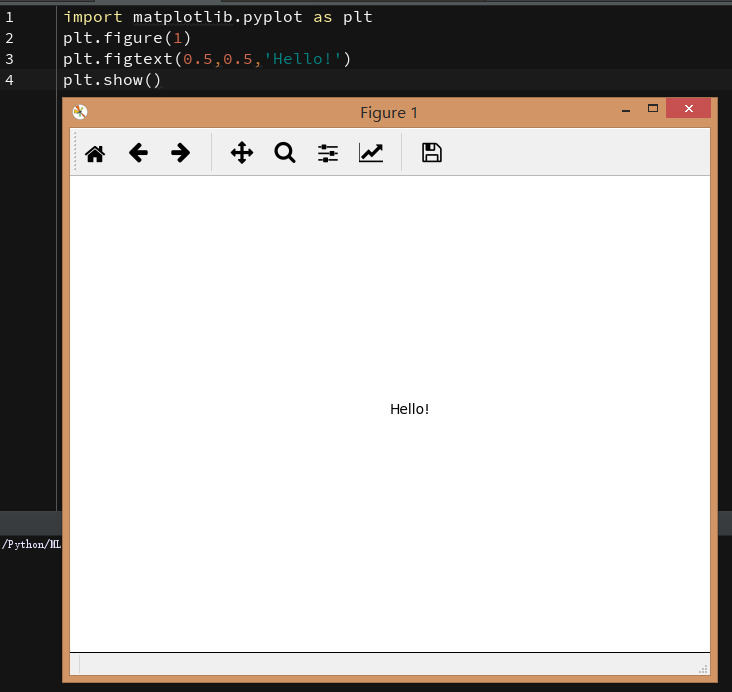
25、figtext() —— 为figure添加文字
参考代码:
import matplotlib.pyplot as plt
plt.figure(1)
plt.figtext(0.5,0.5,'Hello!') # 前两个参数为坐标,取值范围0~1,0.5表示中间,第三个参数是文字内容
plt.show()
操作结果:
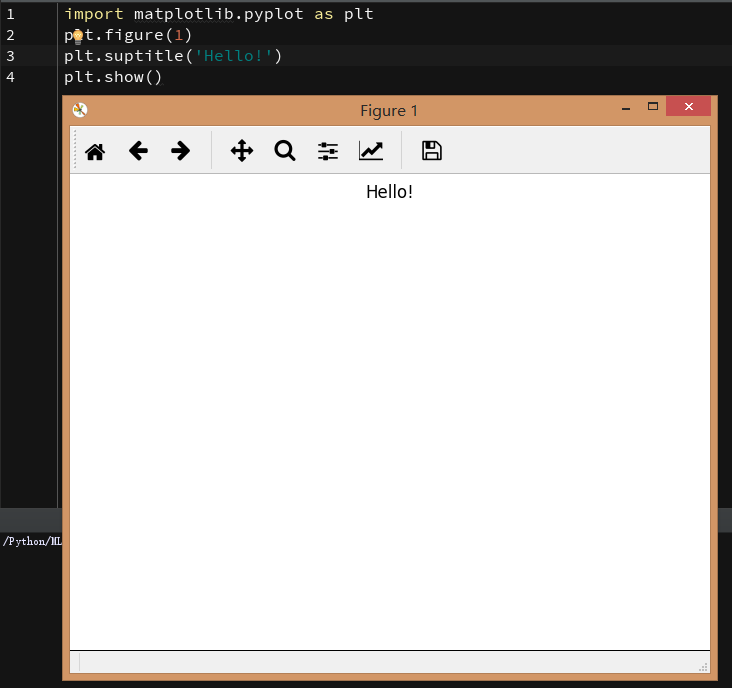
26、suptitle() —— 为figure添加总标题
参考代码:
import matplotlib.pyplot as plt
plt.figure(1)
plt.suptitle('Hello!')
plt.show()
操作结果:
27、figimage() —— 添加一个非重采样图像
[待补充]
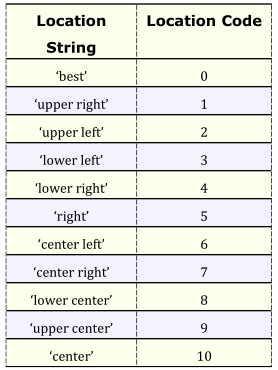
28、figlegend(arg1,arg2,arg3) —— 为figure添加图例
参数说明:
arg1:一条Line2D实例
arg2:字符串,图例的说明
arg3:图例的位置,对应的位置如下图:
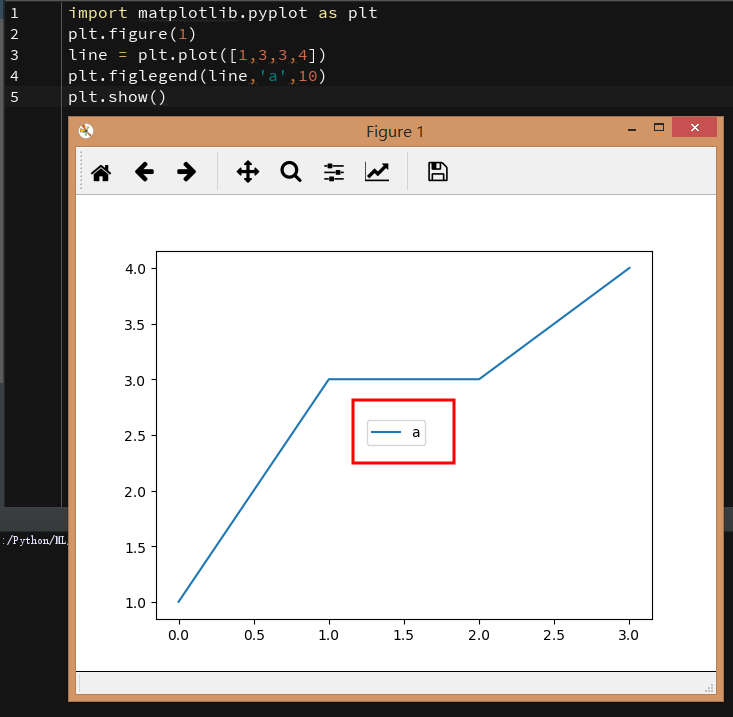
参考代码:
import matplotlib.pyplot as plt
plt.figure(1)
line = plt.plot([1,3,3,4]) # 生成一条Line2D
plt.figlegend(line,'a',10) # 将该图例设置为a,位置在中间
plt.show()
操作结果:
28、hold() —— 锁定当前状态
[待补充] 这里的锁定状态与坐标轴axes有关,看起来像是要锁定当前图像。但是在pyplot中,可以在不锁定的情况下继续绘制第二条线路并不影响。这个问题后边再说。
29、ishold() —— 返回锁定状态
[待补充] 还未研究透彻
30、over() —— 以Hold(True)的方式调用函数并保存当前状态
[待补充]
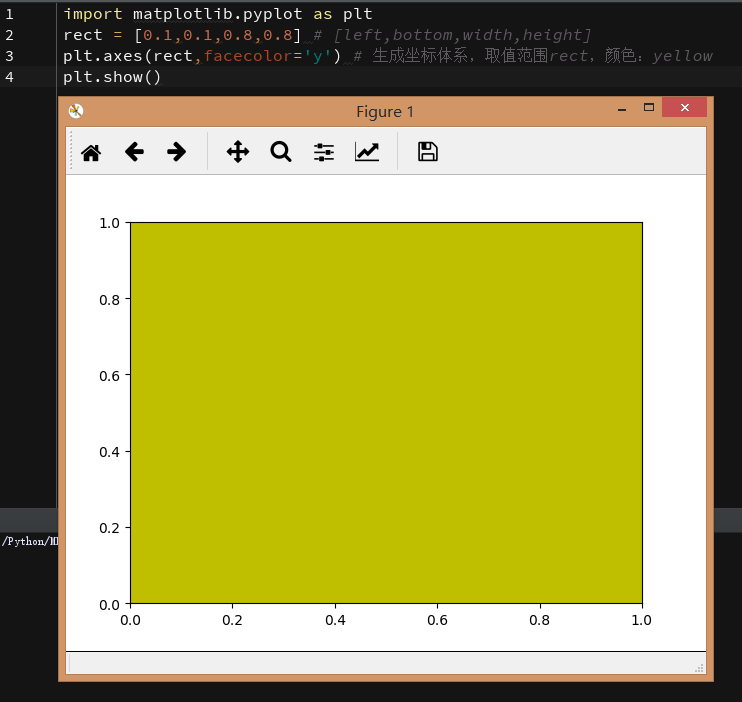
30、axes() —— 为figure添加axes(坐标轴)
参考代码:
import matplotlib.pyplot as plt
rect = [0.1,0.1,0.8,0.8] # [left,bottom,width,height]
plt.axes(rect,facecolor='y') # 生成坐标体系,取值范围rect,颜色:yellow
plt.show()
操作结果:
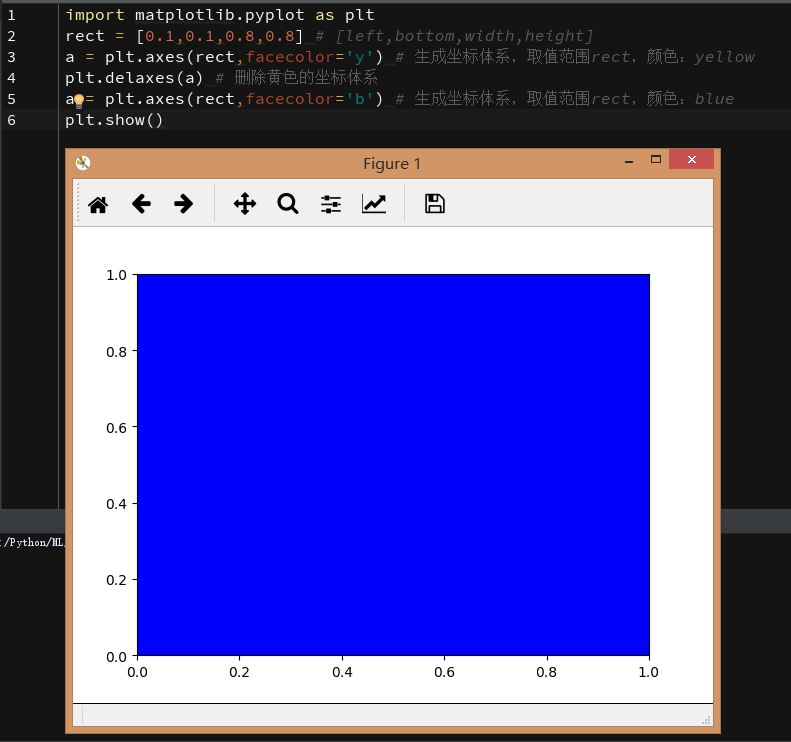
31、delaxes() —— 删除坐标轴
参考代码:
import matplotlib.pyplot as plt
rect = [0.1,0.1,0.8,0.8] # [left,bottom,width,height]
a = plt.axes(rect,facecolor='y') # 生成坐标体系,取值范围rect,颜色:yellow
plt.delaxes(a) # 删除黄色的坐标体系
a = plt.axes(rect,facecolor='b') # 生成坐标体系,取值范围rect,颜色:blue
plt.show()
操作结果:
32、sca() —— 为ax设置当前坐标轴
[待补充]
33、gca() —— 获取当前实例,用于设置属性
[待补充] 经测试,可以通过plt.gca() 捕获当前坐标体系,但无法通过set设置属性,也无法输出
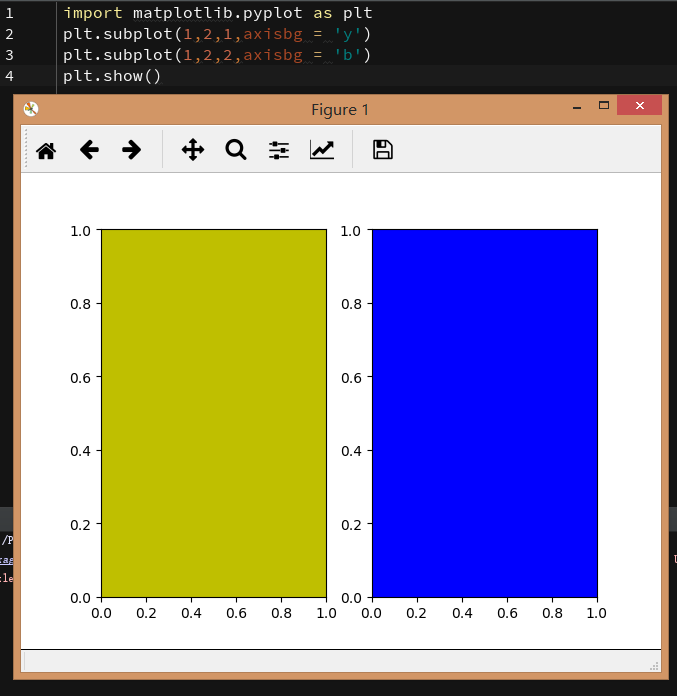
34、subplot(行,列,序号,背景色) —— 在一个图表中绘制多个子图
注意序号决定了放在哪个格子中,从左到右、从上到下依次增加
演示代码:
import matplotlib.pyplot as plt
plt.subplot(1,2,1,axisbg = 'y') # 在一行两列格子中放置1号图,背景为黄色
plt.subplot(1,2,2,axisbg = 'b') # 在一行两列格子中放置2号图,背景为蓝色
plt.show()
操作结果:
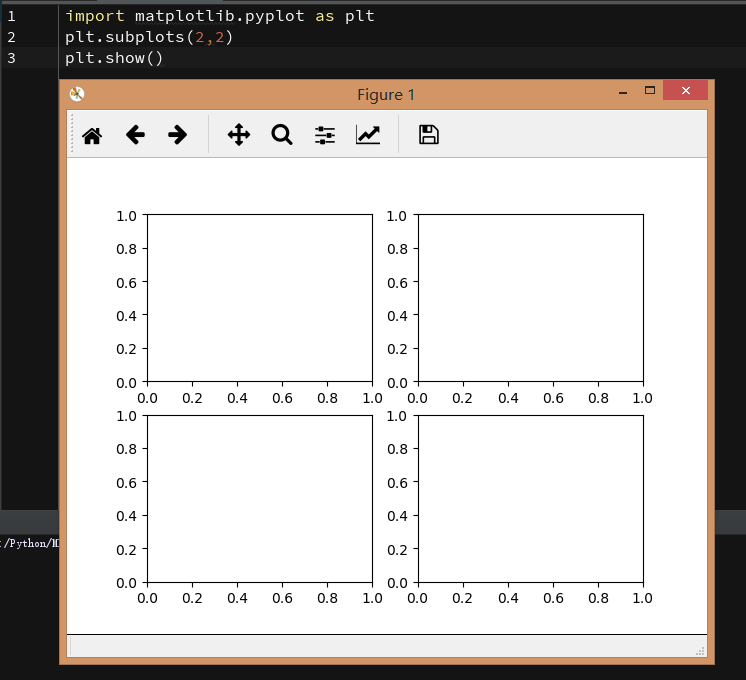
35、supplots() —— 顾名思义,一次弄多张图
演示代码:
import matplotlib.pyplot as plt
plt.subplots(2,2)
plt.show()
操作结果:
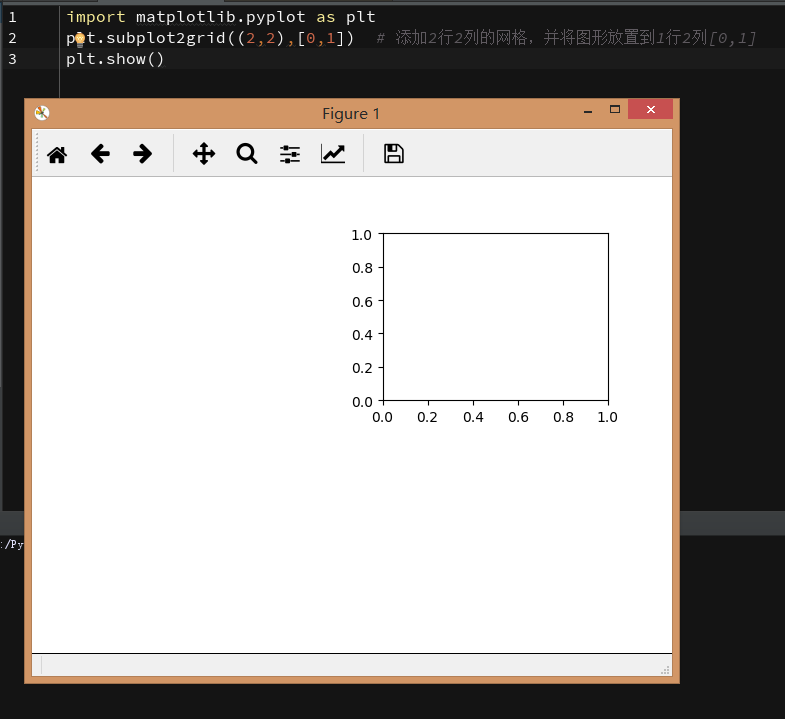
36、subplot2grid() —— 在网格中创建subplot
演示代码:
import matplotlib.pyplot as plt
plt.subplot2grid((2,2),[0,1])  # 添加2行2列的网格,并将图形放置到1行2列[0,1]
plt.show()
操作结果:
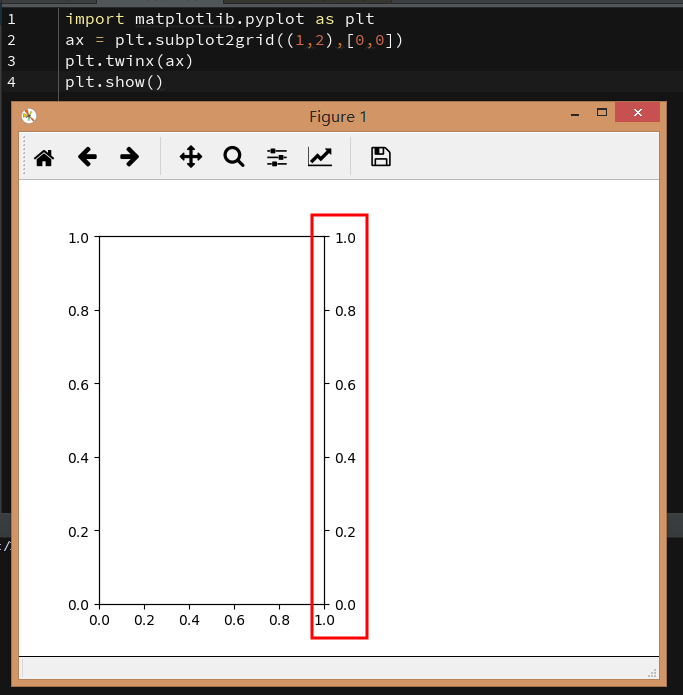
37、twinx() —— 绘制与之前axes图轴共用x轴的axes,新的图将被放在右侧。如果ax=None,则覆盖ax,并返回ax2
演示代码:
import matplotlib.pyplot as plt
ax = plt.subplot2grid((1,2),[0,0])
plt.twinx(ax)
plt.show()
操作结果:
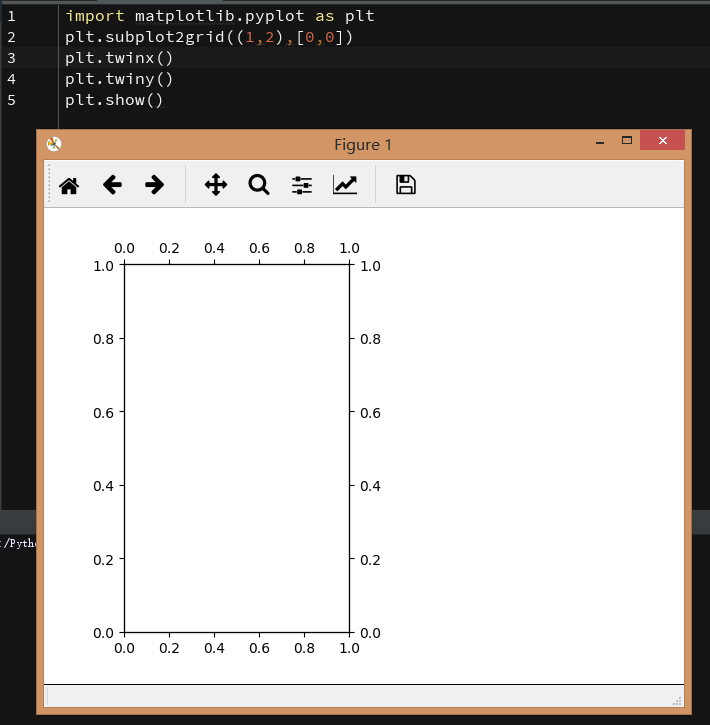
38、twiny() —— 使用方法类似twinx,不同的是变成了y轴
演示代码:
import matplotlib.pyplot as plt
plt.subplot2grid((1,2),[0,0])
plt.twinx()
plt.twiny()
plt.show()
操作结果:
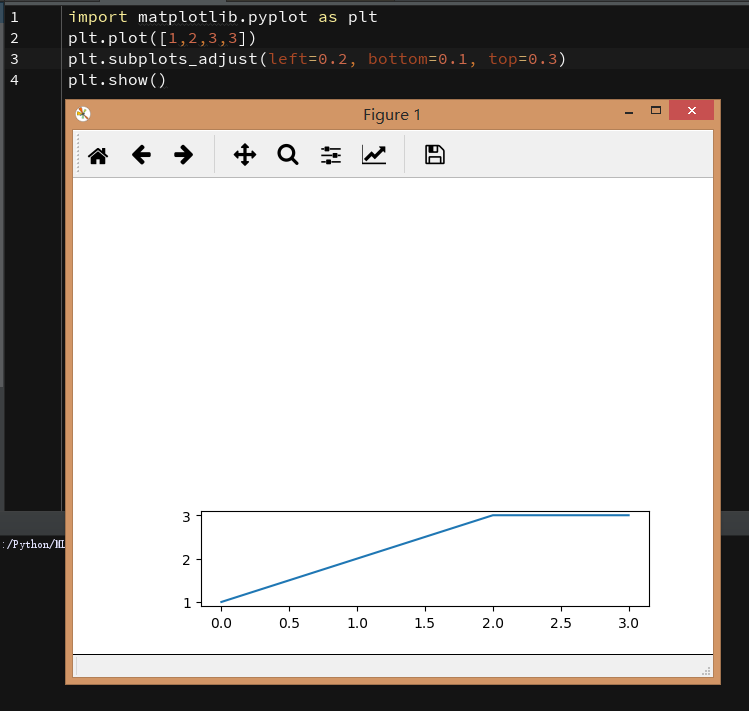
39、subplots_adjust() —— 调整subplot布局
参数:subplots_adjust(left=None, bottom=None, right=None, top=None,
wspace=None, hspace=None),参数取值[0,1]
参考代码:
import matplotlib.pyplot as plt
plt.plot([1,2,3,3])
plt.subplots_adjust(left=0.2, bottom=0.1, top=0.3)
plt.show()
操作结果:
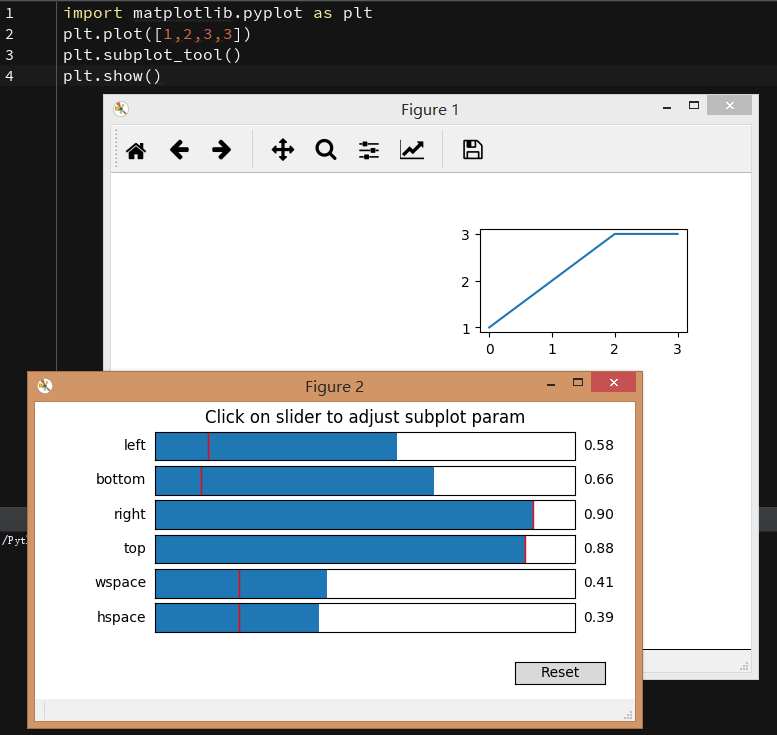
40、subplot_tool() —— 打开图像的subplot工具窗口
可以通过点击蓝色进度条,调整图形参数。
演示代码:
import matplotlib.pyplot as plt
plt.plot([1,2,3,3])
plt.subplot_tool()
plt.show()
操作结果: